1 Worst in Bangalore
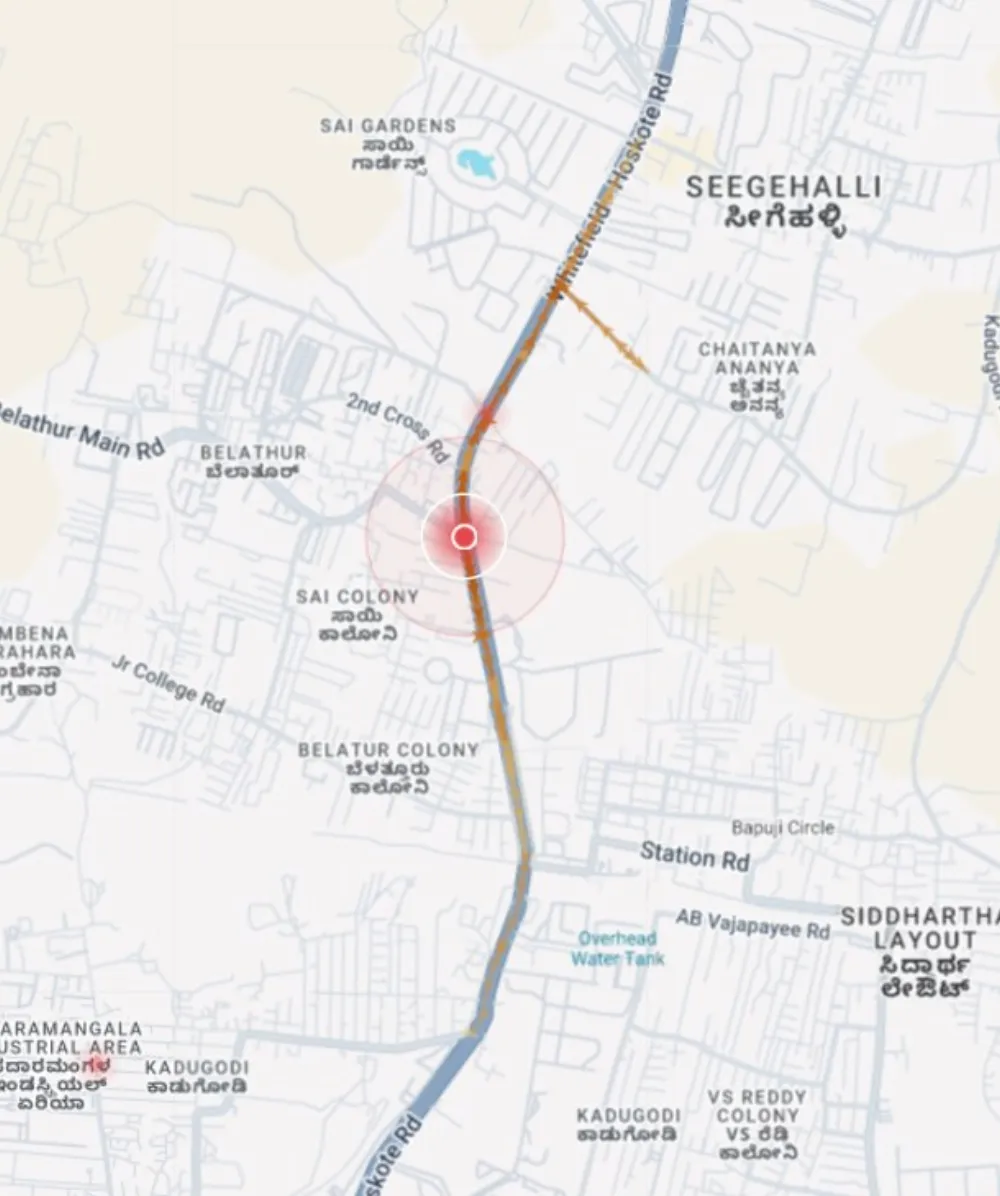
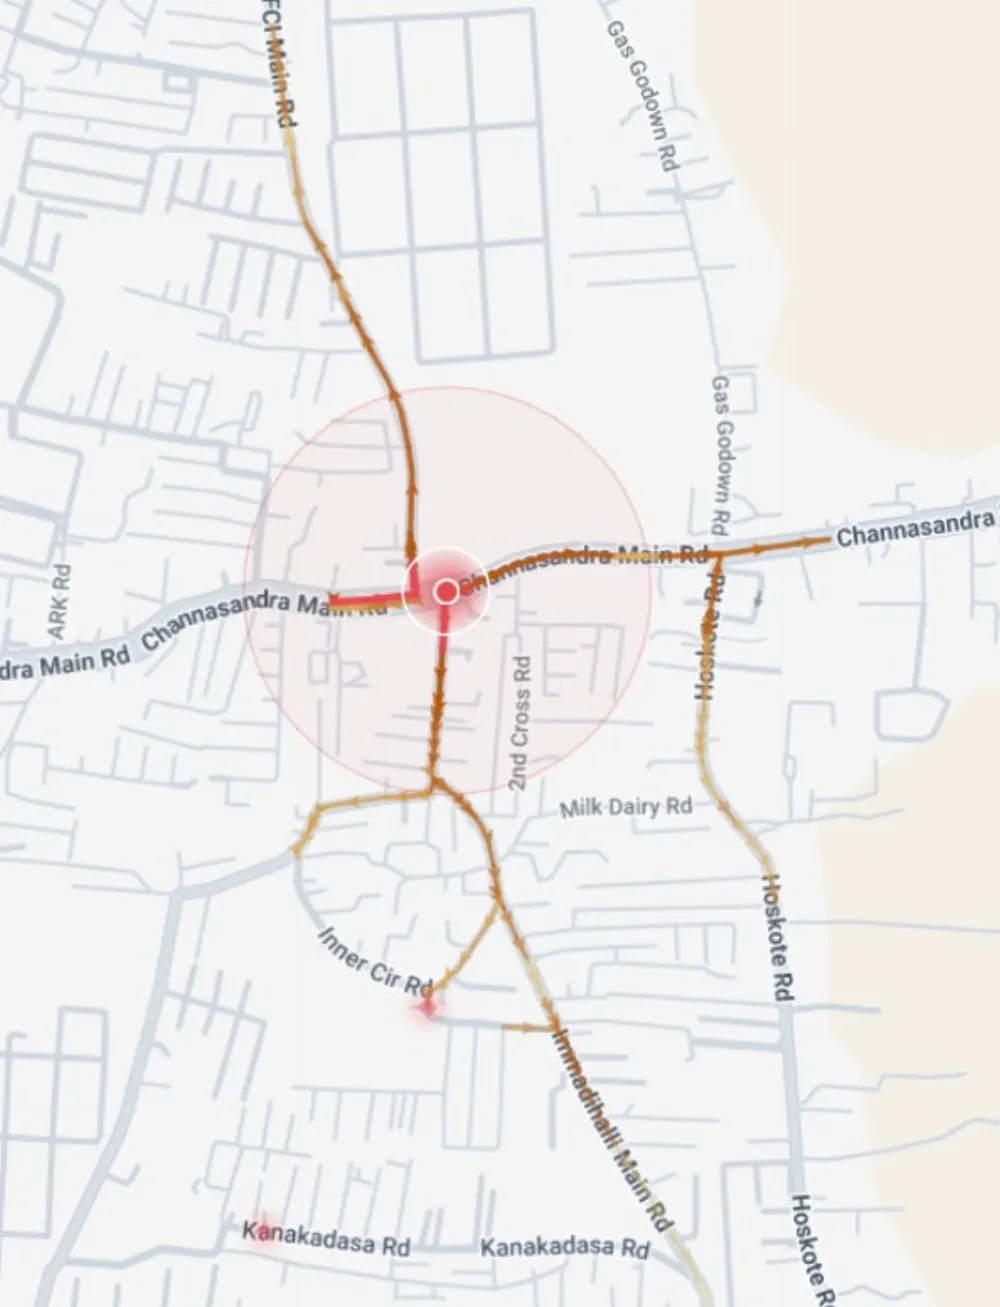
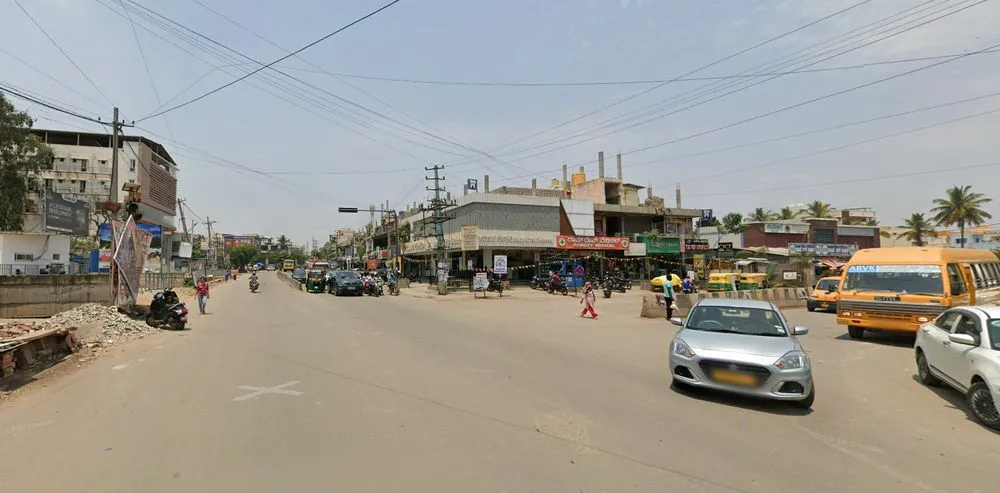
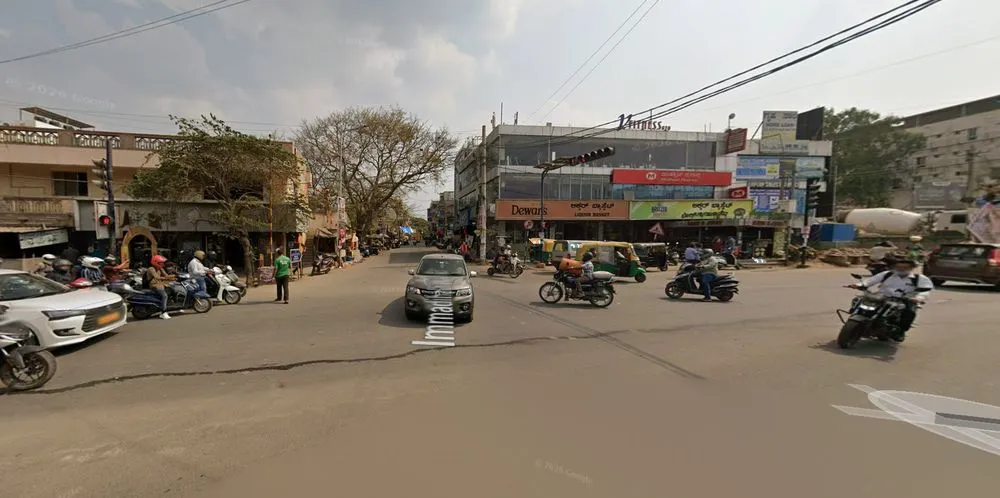
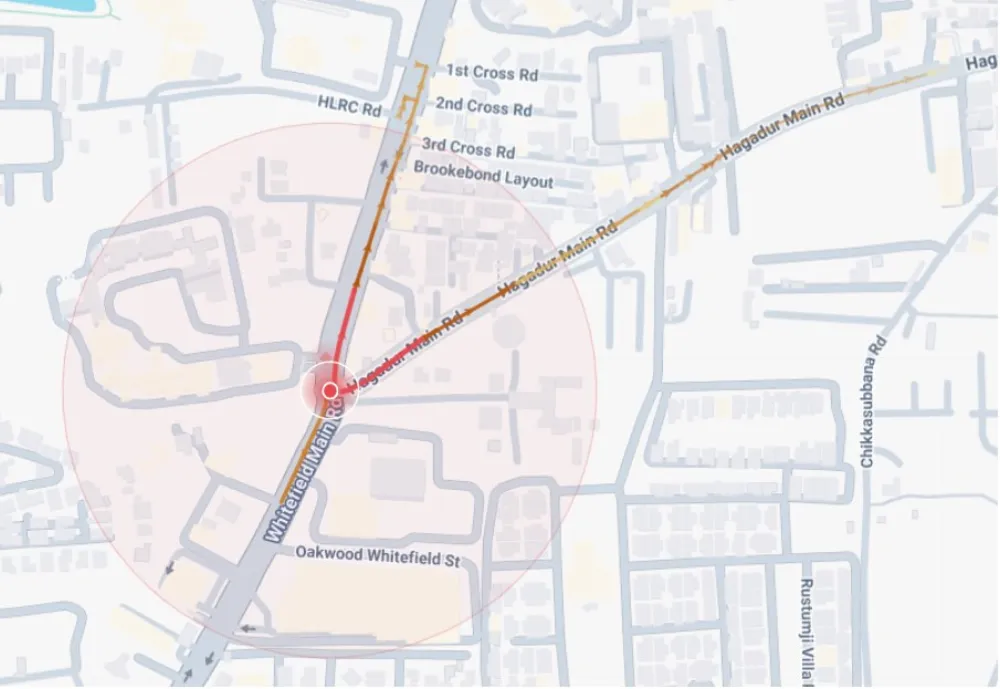
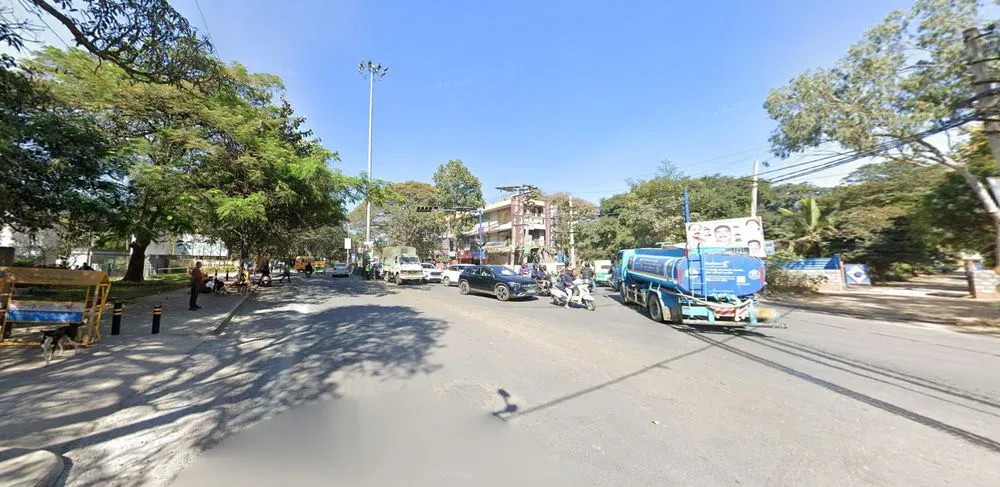
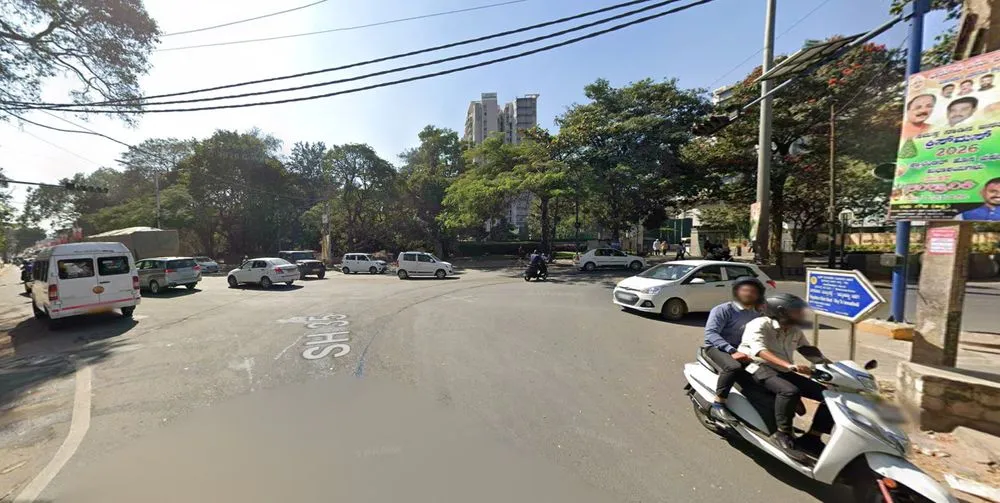
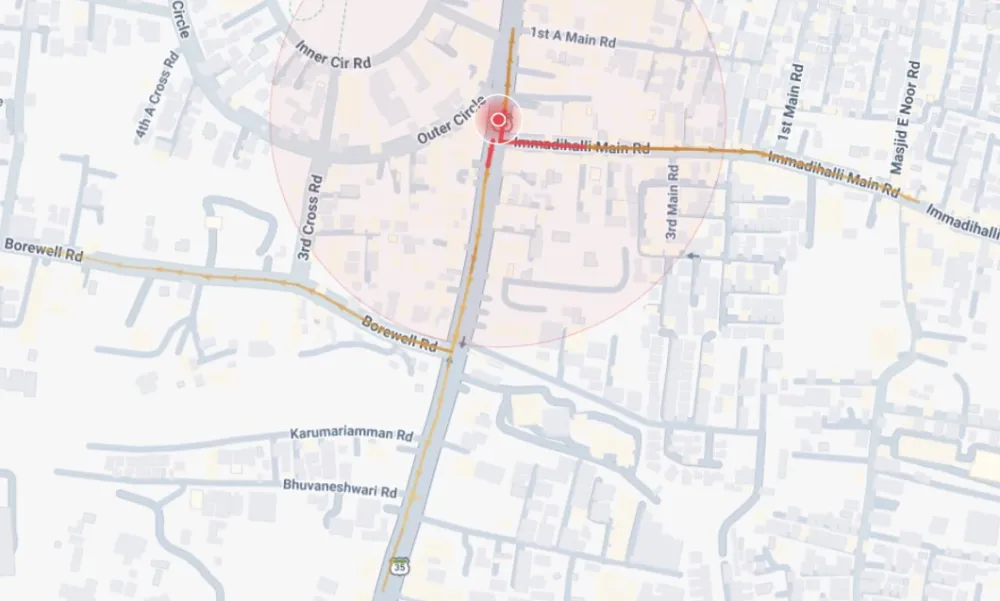
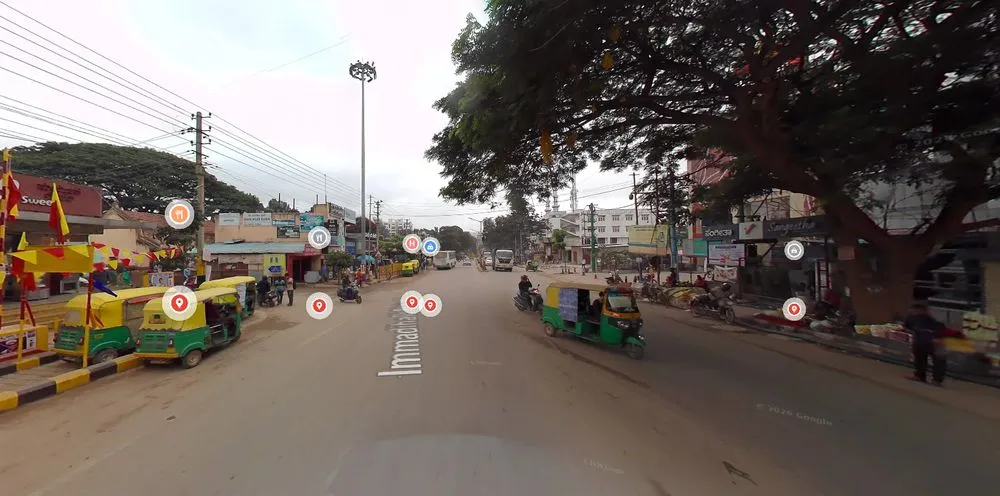
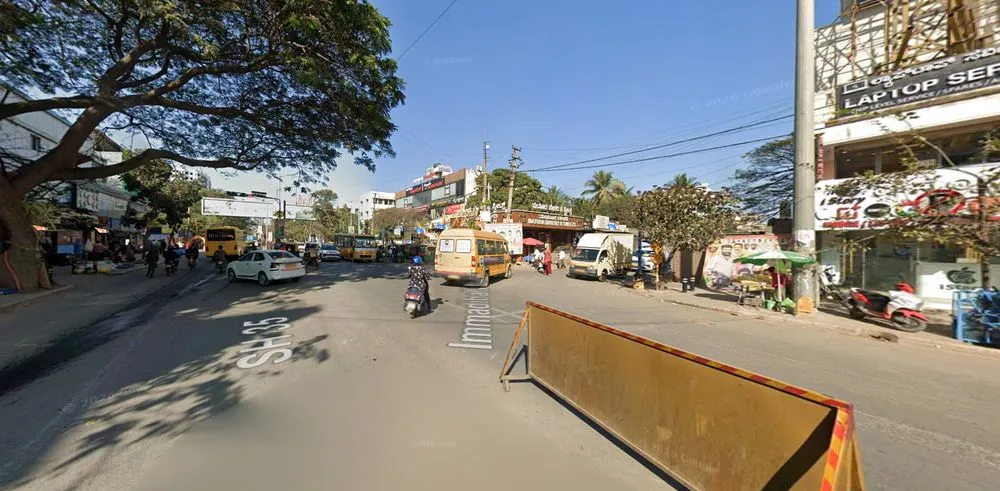
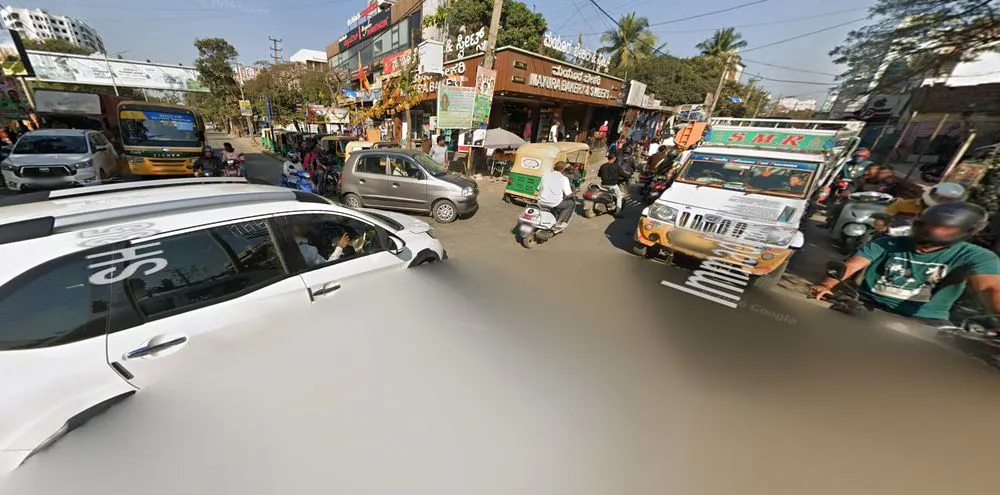
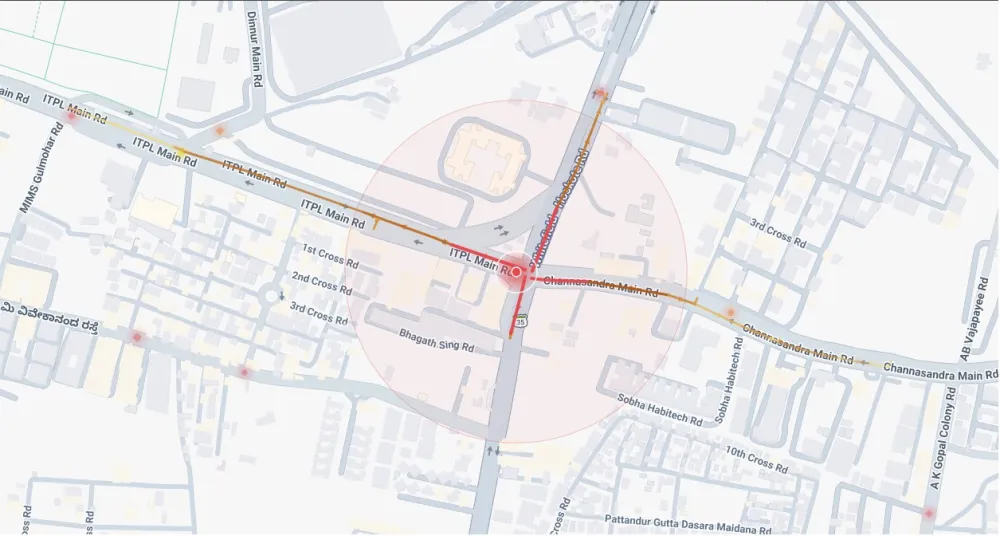
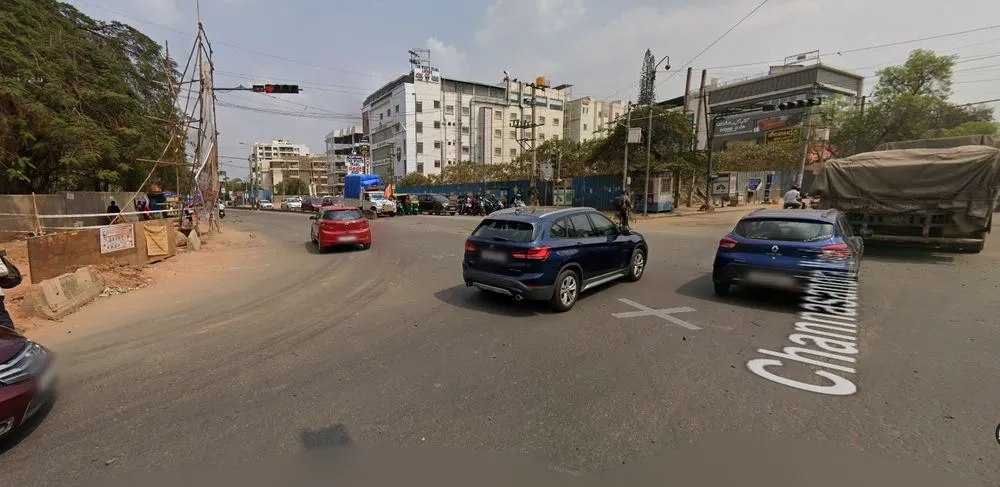
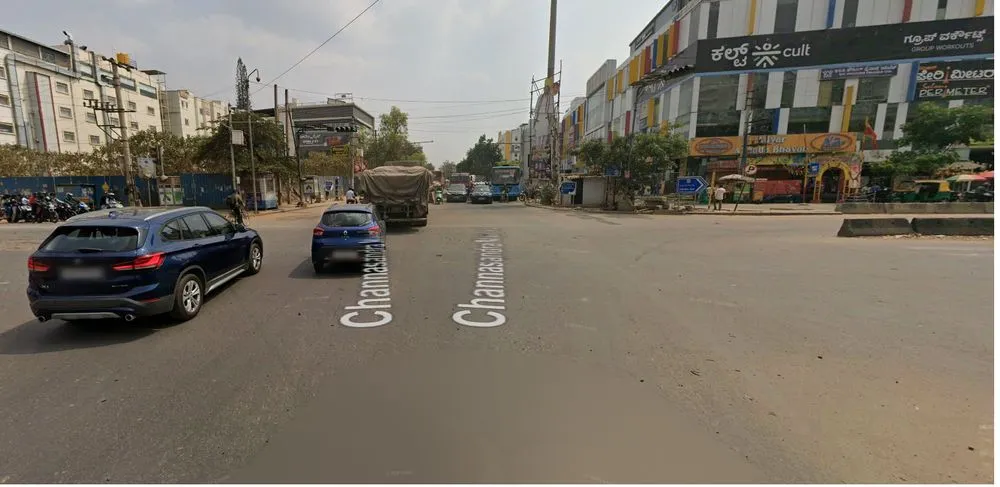
Whitefield Main Rd × Channasandra Main Rd
Kadugodi / Hopefarm · A 4-way crossing between two metro stations. Jams 7:50 am to 11:20 pm.
7.7Jam speed km/hnormal 17
4.3 minExtra per kmthe worst spot anywhere
1.7 kmBacks upall four arms
32/32Days it jamsevery day
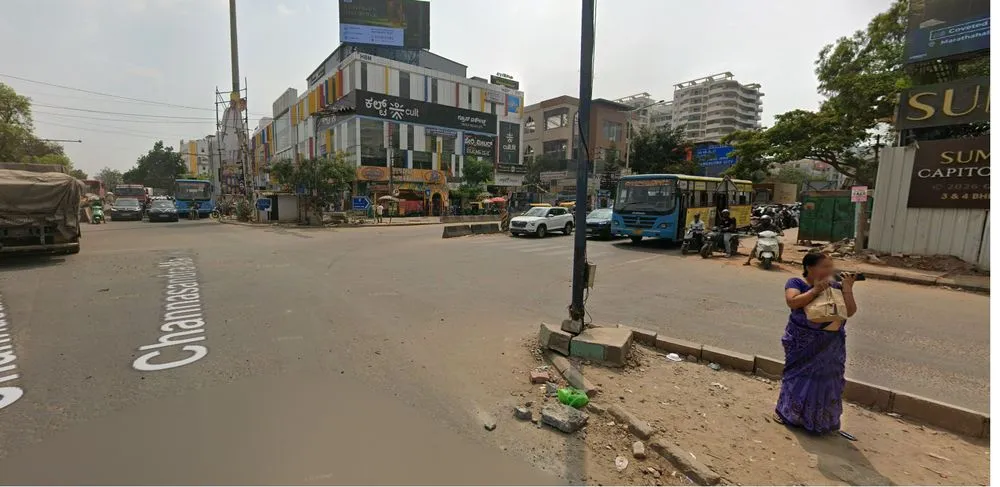
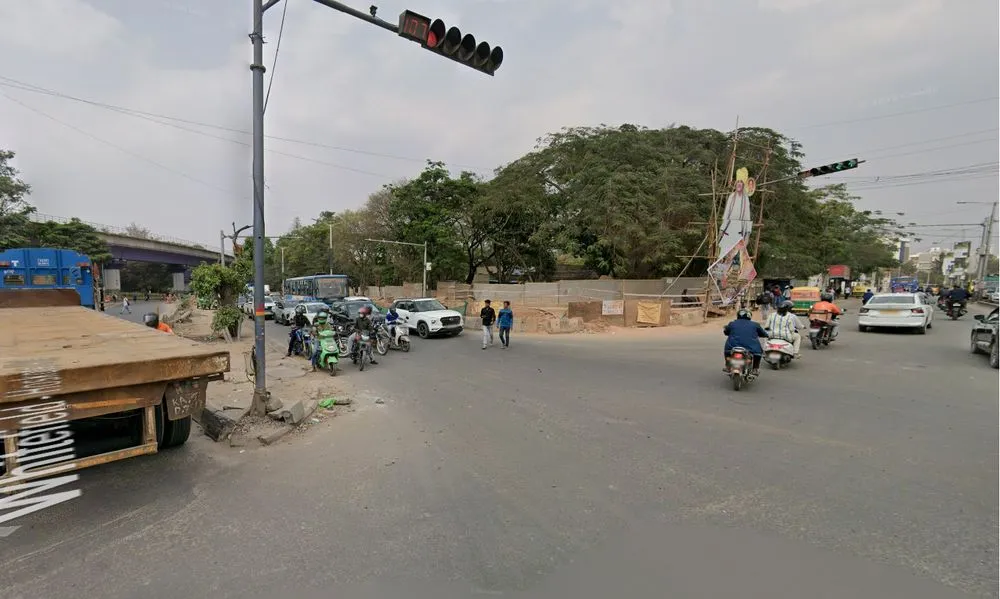
Why it happens
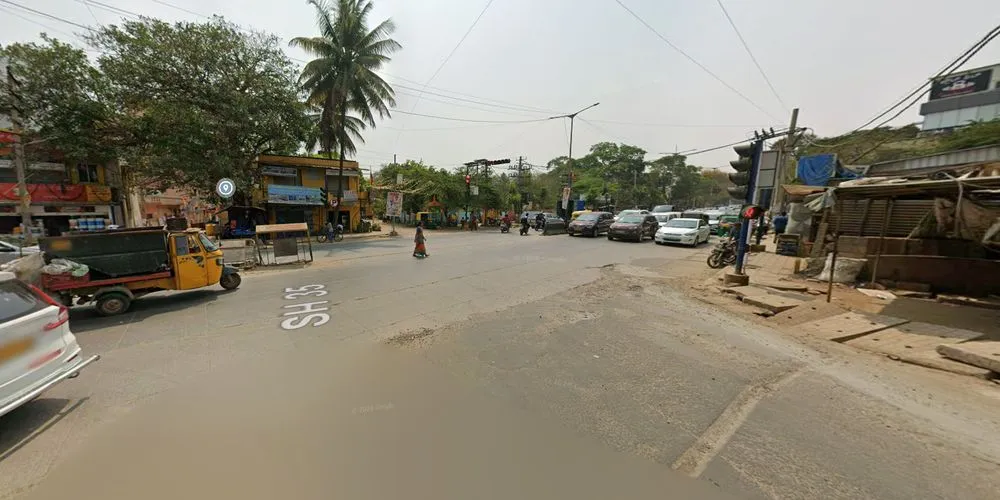
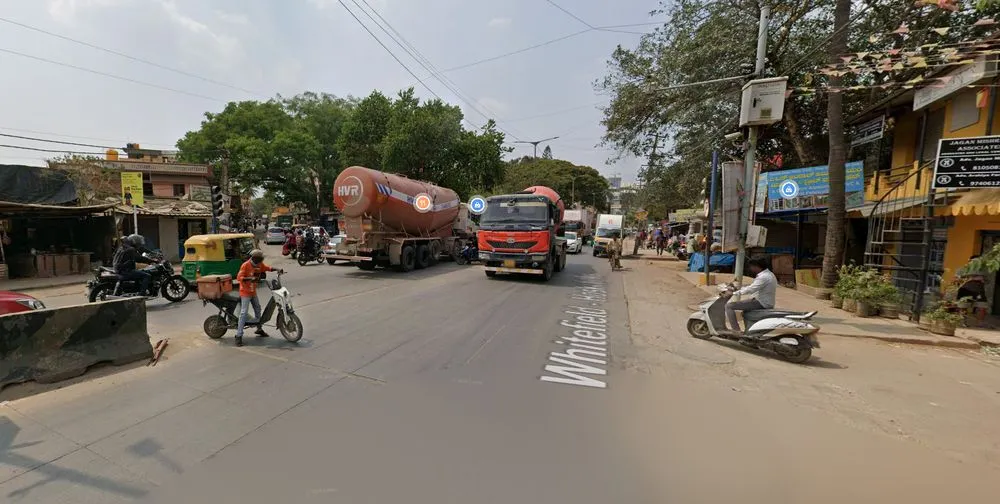
- Two big roads cross at a tiny 220 m² spot, so eight lanes in and eight out fight for the same space.
- Signal-controlled but a wide open-mouth crossing with no islands or turn lanes, and broken medians let vehicles U-turn anywhere.
- Metro pillars eat the right-turn room, buses halt in the running lane, and traffic leaving the junction is itself stuck, so the queue cannot drain.
Cheapest first move
Audit and retime the existing signal: protected turn phases plus a strict keep-the-box-clear rule. Then add channelizing islands, turn lanes, and rebuild the broken medians.
Bigger fix, later Grade-separate the heavier road (a Hope Farm Junction underpass is already being fast-tracked here), and strengthen last-mile feeders to the two flanking metro stations to pull car trips off the crossing.
Spot #1 · Whitefield Main Rd × Channasandra Main Rd, Kadugodi / Hopefarm (12.9838, 77.7524)